

The article below was written by Dave Lewis for the SnailWorks September newsletter, and reprinted with permission.
When you are looking at USPS service performance a week at a time it can be hard to detect trends. You really need to step back and look at larger time spans to get some definition.
SnailWorks began measuring aggregate data in May 2021 and used that data to determine on-time percentages and days to deliver for First-Class letters and flats, as well as Marketing Mail letters and flats. Our criteria for including a mailpiece in our measurement was that the piece must have a valid start-the-clock event and be tracked to delivery. Since June 2021, we have included more than 4.7 billion pieces of mail in measurement, building what we feel is a very relevant sample set.
So, how is mail service looking? First-Class Mail is getting slower. Marketing Mail is more complicated.
First-Class Mail – Letters
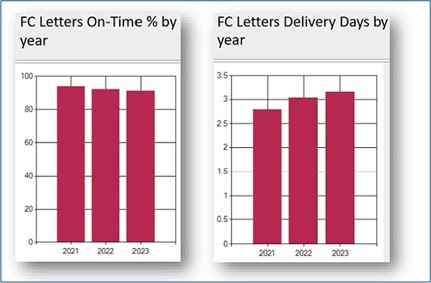
We measure on-time percentage and days-in-transit from induction to delivery.
First-Class letters were delivered “on time” by USPS standards 93.8% of the time in the period from June 2021 through the end of that year. In 2022, First-Class letters were on time 92.3%, a decline of 1.6% although service standards were relaxed in October 2021. YTD in 2023 First-Class letters have been on time 91.2% of the time, another 1.2% decline. So, overall, First-Class letters have been late 2.8% more often than in 2021, even against relaxed standards.
During that same time period, the average number of days to deliver a letter increased from 2.79 days in 2021 to 3.03 days in 2022, to 3.15 days in 2023 YTD. That turns out to be a slowdown of 13%.
First-Class Mail – Flats First-Class flats are a little tougher to measure. Still, there is enough data to draw conclusions. Week-to-week, service performance for flats has been very uneven. But looking at the annual averages makes it clearer. In 2021 91.8% of flats were delivered on time by the same standards used for letters. That on-time percentage dropped to 90.0% in 2022, and has plummeted to 73.5% in 2023, YTD. Service on First-Class flats appears to be in a free fall.
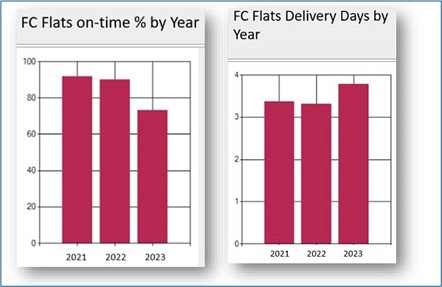
Interestingly, the days-in-transit for First-Class flats don’t show as dramatic a deterioration, coming in at 3.37 days, 3.32 days, and 3.77 days in 2021, 2022, and 2023 respectively, a 12% slowdown.
Marketing Mail
Marketing Mail, happily, is a much better story. Its measurement is more complicated than First-Class Mail because it is often transported by mailers to a destination facility for entry, so it tends not to travel as far. We try to compensate for that by not including mail inducted and delivered in the same SCF.
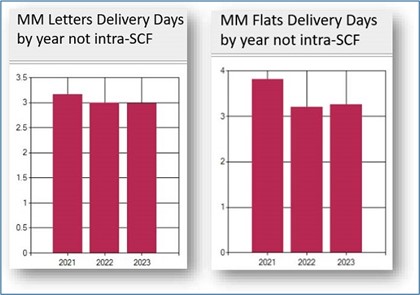
The on-time percentage for Marketing Mail letters improved from 94.7% in 2021 to 97.4% in 2023, an improvement of 2.4%. Of course, standards are very generous for Marketing Mail, so they represent an easier target. Days-in-transit improved from 3.16 days in 2021 to 2.50 days in 2023. Do keep in mind that these are generally inducted closer to the delivery point than First-Class Mail. Still, anecdotally, we have seen very impressive transit times for Marketing Mail letters. Marketing Mail flats also saw a small improvement in on-time delivery, going from 89.6% on time in 2021 to 92.0 on time in 2023. Days-in-transit dropped from an average of 3.82 days in 2021 to 2.82 in 2023 (YTD).
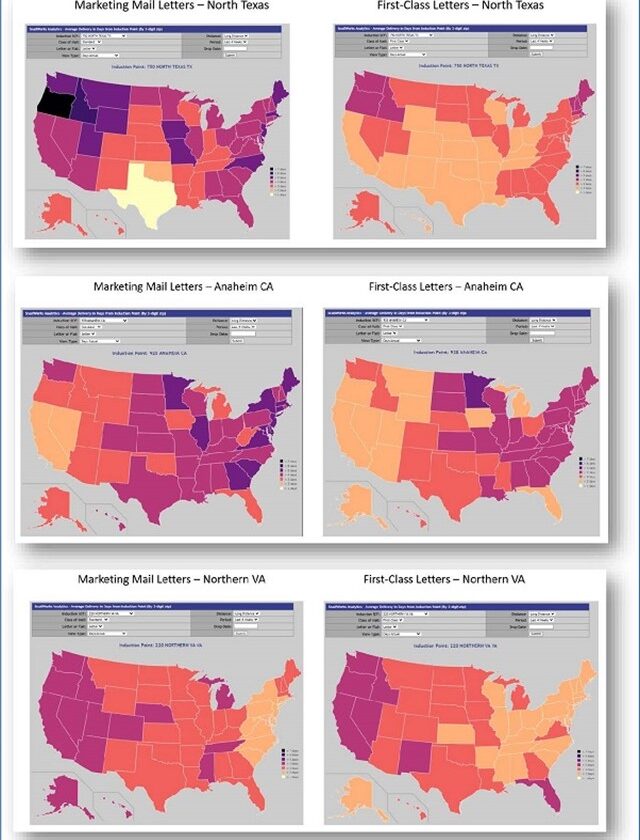
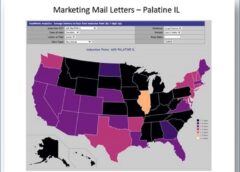
Geographic Variances
Overall, we do not see great geographic variances except in certain anomalous situations. Still, it can matter where mail is inducted. Maps above compare service for First-Class and Marketing Mail letters inducted in North Texas, Anaheim, and Northern Virginia. Service from those induction points seems comparable, although, logically, it takes longer for mail from Anaheim to deliver in New Jersey than mail from Virginia.
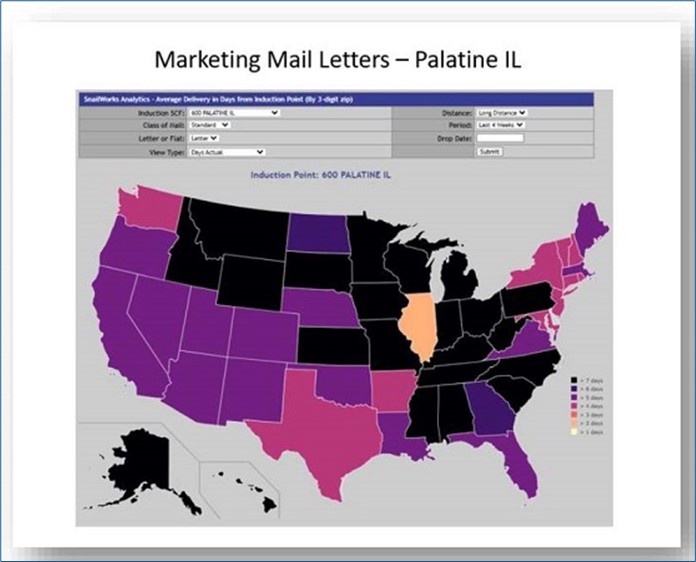
Still, there are some areas that can be problematic. Marketing Mail entered in Palatine (IL) doesn’t perform like mail inducted on the coasts. Most other Chicagoland facilities don’t fare much better.
So, what practical guidance can we get from all of this?
- First-Class letter service is declining, which is concerning. Although it is not precipitous, it bears watching.
- First-Class flats are more alarming. Service is very uneven and becoming more difficult to track.
- Marketing Mail service has remained very steady and has improved in many cases. It may be a valid lower cost alternative.
All these results are based on large, generalized samples – the only mail that really matters is yours. Tracking your own mail is more important than ever. Most of the analytics you see here are available to SnailWorks subscribers. Contact us to learn how.
The USPS story
The preceding article reports on USPS service performance based on the measurement of mail from a wide range of commercial mail producers. However, the picture it paints is different from what the Postal Service wants customers to believe. In weekly press releases, the USPS regularly claims it “continues to make service delivery improvements,” but those claims are inconsistent with what SnailWorks and other service monitors have found.
Sample size, sample selection, and the bases for inclusion or exclusion from the sample can impact the result eventually calculated, but both SnailWorks and the USPS are looking at large volumes of the same type of mail and mailings.
As the preceding article notes, Marketing Mail scores are often skewed by the high proportion of mail that is destination-entered. Nonetheless, in PQ III (April-June), the Postal Service’s own data showed that about one-fifth of Marketing Mail letters, and about 28% of Marketing Mail flats, were not “in measurement.” About 31% of First-Class Mail letters and 38% of First-Class Mail flats were similarly excluded, as were over 45% of Periodicals.
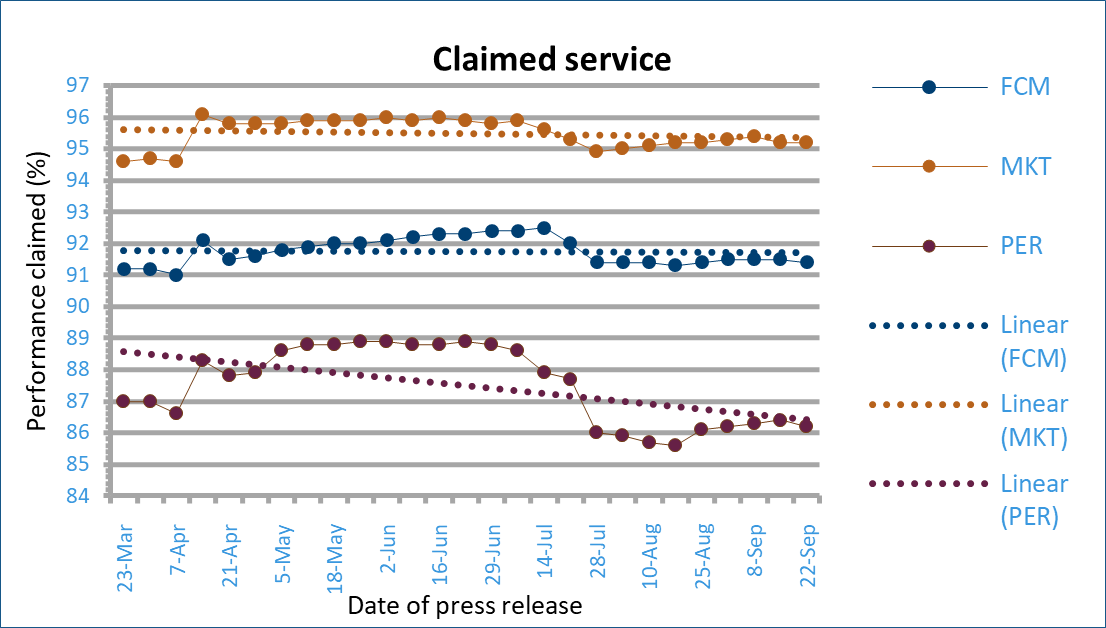
The chart above is based on the agency’s weekly service releases. Notably, despite regular claims of continuously improved service, its data shows service has been flat or worsening over the past six months, after a curious jump in April. It’s unknown whether the USPS believes that its customers have no independent ways to measure service, but it’s readily seen that its claims are at variance with both its own data and the findings of others. Under the direction of PMG Louis DeJoy, the PR mantra seems to be “keep telling the same story; eventually, people will believe it.” Truth, accuracy, and objectivity apparently are optional.
If you're on this page, it's likely because you have challenges to find solutions for or a question to answer. Fortunately, you've come to the right place. Click below to download our 2023 Services brochure to learn just how much we have to offer. Leave your name and email if you'd like us to stay in touch.
The brochure is a PDF that will open in a new browser window. Download, read, share, and let us know if you have questions.